The Hidden Risks of AI-Built Nutrition Labelling Software
Key takeaways Artificial intelligence is changing the software industry at an extraordinary pace. Today, someone with an idea and access
🍂 Save 20% this fall – code 8J4NS8JR. Ends Nov 30. Get the offer.
Calculate a PDCAAS score in seconds and identify the limiting amino acid affecting protein quality.
Choose Quick mode for instant results, Advanced mode for detailed amino acid analysis, or Blend mode to evaluate two protein sources.
Quick mode uses your AAS. Use Advanced if you want the tool to compute AAS + limiting amino acid from amino acid data.
Enter all 9 amino acid groups. Combined groups must be entered as sums.
Combine two protein sources. The amino acid profile and digestibility are weighted by their actual protein contribution.
For ingredient weight blends, protein concentration is required for both ingredients. For mg/100g food inputs, protein concentration is also required for normalization.
| Amino acid group | Test (mg/g) | Reference (mg/g) | Ratio | Note |
|---|
Explore how PDCAAS is calculated, how digestibility affects protein quality, and what food manufacturers need to know.
Read the Complete PDCAAS Guide ↗Results depend on input quality, reference pattern, and digestibility method. Verify before using for regulatory or claims decisions.
PDCAAS (Protein Digestibility-Corrected Amino Acid Score) is a method for estimating protein quality by combining:
How essential amino acids compare with a reference requirement pattern.
The proportion of protein digested and absorbed, estimated using a digestibility measurement.
PDCAAS is often capped at 1.0 (100%), so multiple proteins can tie at the top.
PDCAAS is typically reported on a scale from 0 to 1.0, with higher scores indicating better protein quality under the selected reference pattern.
These ranges are illustrative, not official PDCAAS classifications. Actual results depend on amino acid composition, digestibility, and the reference pattern used.
People often look for a PDCAAS chart or PDCAAS food list to benchmark proteins. Values vary by source, processing, and digestibility method; treat these as examples, not definitive numbers.
High-quality, highly digestible protein
Complete milk protein
Complete essential amino acid profile
Generally high protein quality
Milk-derived protein; varies by formulation
High-quality plant-based protein
Often limited by sulfur amino acids
Often limited by lysine
Protein quality can vary significantly between isolates, concentrates, whole foods, and processed ingredients.
Values are approximate and provided for general comparison only. They are not authoritative values for a specific ingredient or product. Use measured amino acid and digestibility data for formulation and regulatory decisions.
PDCAAS is widely used and commonly referenced, but DIAAS is used in some research contexts and may be preferred in certain applications.
This tool is for PDCAAS. If you’re making labelling or marketing claims, confirm which method and reference pattern are expected for your market and use case.
Protein Digestibility-Corrected Amino Acid Score.
Compute the Amino Acid Score (AAS) from the lowest essential amino acid ratio relative to a reference pattern, then multiply by true protein digestibility. PDCAAS is often capped at 1.0.
Often yes. This calculator shows both capped and uncapped results.
Yes, use Blend mode. For best results, blend by protein contribution (not ingredient weight).
Read the full guide here: https://www.menusano.com/protein-digestibility-pdcaas-guide-food-manufacturers/
MenuSano helps food businesses manage nutrition analysis, recipe formulations, and nutrition labelling in one centralized platform.
Simple Interface, Good Feature Set, Excellent Price. Very easy to use, and comes with a short tutorial.
Trevor Nawalkowski - Trevor's Pizza
Sending our recipes to a nutritionist, or out to a lab and having to wait three weeks for results is timely. Instead we use MenuSano, a web-based nutritional calculator. It really has made this journey easier for me.
Thao Nguyen - BonBon Collections
MenuSano delivered on all fronts; nutrition labeling, ingredient sourcing, and all kinds of applications we hadn't even thought of. Sooo intuitive and easy to use, not sure where we would be without them!
Eric Krautheim - Township 27
I was immediately impressed by their expertise and openness to feedback.
Caroline - Boundary Labels
MenuSano allows us to calculate our recipes with accuracy and instantly, it checks potential variations in the recipe.
Kevin Harbison - Bridgehead
The one thing we were surprised to find out is how much sodium our recipes contain. We thought we used minimal salt but Menusano helped us discover that some of our recipes contained a surprising amount, which made us change some of our recipes.
Grace Willows - Windmill Bakery
The best software by far for food companies. This software saved me. I had a deadline and the person I usually get to do my nutritional was not available. Thanks to this software, we will be doing it all ourselves from now on.
Jessica Otano - Jessica's Gourmet
MenuSano was able to adapt, use creativity, grow, and even assist in projects to ensure our company met our client requests.
Jon Trelfa - Trelfa LabsCreate a Nutrition Facts label for your food products.
Create Nutrition Label ↗Identify potential allergens in your recipes and ingredients.
Check Allergens ↗Estimate product shelf life using storage and product information.
Calculate Shelf Life ↗Calculate UK HFSS scores for food and drink products.
Calculate HFSS Score ↗Create Supplement Facts labels for your dietary supplement products.
Generate Supplement Facts Label ↗
Key takeaways Artificial intelligence is changing the software industry at an extraordinary pace. Today, someone with an idea and access

Nutrition has always run on data. Ingredients, quantities, recipes, serving sizes, nutrient values, allergens, dietary records, and food composition databases.
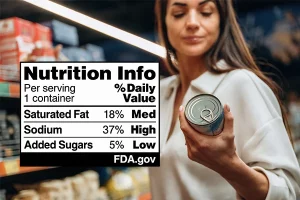
The FDA’s proposed front-of-package (FOP) nutrition labelling requirements could change how food manufacturers display nutrition information on packaged products in

If you’re not 100% sure yet, start with our free trial and upgrade when you’re ready.
We take your privacy seriously and will never share your information.
This website uses cookies to enhance your browsing experience and provide personalized content.
By clicking 'Accept', you agree to the storing of cookies on your device to enhance site navigation, analyze site usage, and assist in our marketing efforts.
Powered by cookie-banner.ca